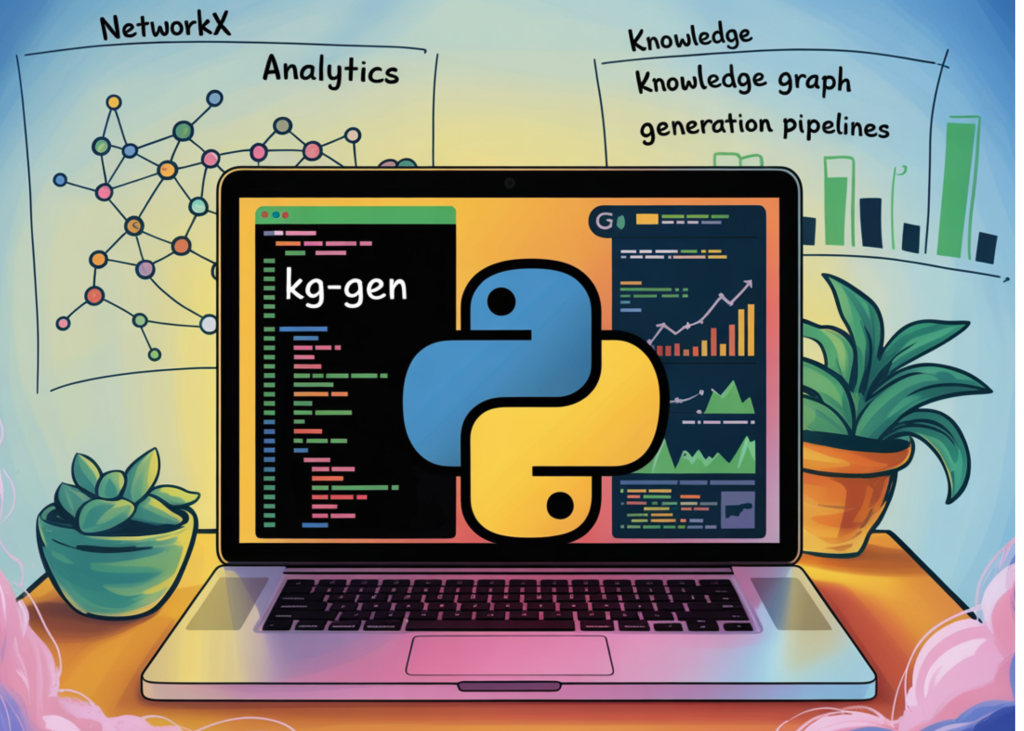
In this tutorial, we will generate knowledge graphs from plain text, conversations, and multiple source documents using kg-gen. We start by setting up the required dependencies and configuring an LLM through LiteLLM, then we extract entities, predicates, and relationships from simple text. As we move forward, we work with longer passages using chunking and clustering, combine knowledge graphs from different sources, visualize graph structures, and analyze them using NetworkX. By the end, we will build a complete workflow that turns unstructured text into an interpretable, searchable, visual, and exportable knowledge graph.
import subprocess, sys
def pip_install(pkgs):
   subprocess.run([sys.executable, "-m", "pip", "install", "-q", *pkgs], check=True)
pip_install([
   "kg-gen",
   "networkx>=3.1",
   "pyvis",
   "matplotlib",
   "python-louvain",
])
import os, json, getpass, textwrap
from collections import Counter
from kg_gen import KGGen
import networkx as nx
from pyvis.network import Network
import matplotlib.pyplot as plt
from IPython.display import HTML, IFrame, display
MODEL    = "openai/gpt-4o-mini"
KEY_NAME = "OPENAI_API_KEY"
def fetch_key(name):
   try:
       from google.colab import userdata
       v = userdata.get(name)
       if v: return v
   except Exception:
       pass
   if os.environ.get(name):
       return os.environ[name]
   return getpass.getpass(f"Enter {name}: ")
os.environ[KEY_NAME] = fetch_key(KEY_NAME)
kg = KGGen(model=MODEL, temperature=0.0)
print(f"✓ KGGen initialized with model={MODEL}")
We begin by installing all the required libraries for knowledge graph generation, graph analytics, and visualization. We then import the core packages, including kg-gen, NetworkX, PyVis, Matplotlib, and display utilities for Colab. We also configure the API key and initialize KGGen with the selected model so that we can start generating graphs from text.
print("n" + "="*70 + "n SECTION 1 — Basic extractionn" + "="*70)
simple_text = (
   "Linda is Josh's mother. Ben is Josh's brother. "
   "Andrew is Josh's father. Josh studies at Stanford University."
)
g_basic = kg.generate(input_data=simple_text, context="Family relationships")
print("Entities :", g_basic.entities)
print("Edges    :", g_basic.edges)
print("Relations:")
for s, p, o in g_basic.relations:
   print(f"   ({s}) -[{p}]-> ({o})")
print("n" + "="*70 + "n SECTION 2 — Chunking + clustering on a long passagen" + "="*70)
big_text = textwrap.dedent("""
   building machines that can perform tasks requiring human-like intelligence.
   data rather than being explicitly programmed. Deep learning is a subset of
   machine learning that uses multi-layer neural networks. Neural nets, also
   called NNs, are inspired by the structure of the brain.
   researchers in 2017. The Transformer architecture underlies modern large
   language models such as GPT, Claude and Gemini. OpenAI released GPT-3 in
   2020 and GPT-4 in 2023. Anthropic, founded in 2021 by former OpenAI
   researchers, develops the Claude family of assistants. Google DeepMind
   develops the Gemini family of models.
   Stanford University hosts the Stanford AI Lab (SAIL) and the STAIR Lab.
   Researchers at Stanford produced the KGGen library, which extracts
   knowledge graphs from plain text using language models. KGGen relies on
   DSPy for structured outputs and routes model calls through LiteLLM, which
   supports providers including OpenAI, Anthropic, Google and Ollama.
""").strip()
g_big = kg.generate(
   input_data=big_text,
   chunk_size=800,
   cluster=True,
   context="History and ecosystem of modern AI",
)
print(f"Entities ({len(g_big.entities)}): {sorted(g_big.entities)}")
print(f"Edges    ({len(g_big.edges)}): {sorted(g_big.edges)}")
print(f"Relations: {len(g_big.relations)}")
for s, p, o in list(g_big.relations)[:15]:
   print(f"   ({s}) -[{p}]-> ({o})")
ec = getattr(g_big, "entity_clusters", None) or {}
if ec:
   print("nEntity clusters (canonical → synonyms):")
   for canon, syns in ec.items():
       print(f"   {canon}: {sorted(syns)}")
We first test kg-gen on a simple family relationship example to extract entities, edges, and relations. We then move to a longer AI-focused passage where we use chunking to handle larger text and clustering to merge similar entities or relationship types. We print the extracted graph components and inspect entity clusters to understand how the model organizes related concepts.
print("n" + "="*70 + "n SECTION 3 — Conversation extractionn" + "="*70)
messages = [
   {"role": "user", "content": "Who founded Anthropic?"},
   {"role": "assistant", "content": "Anthropic was founded in 2021 by Dario Amodei and Daniela Amodei, along with other former OpenAI researchers."},
   {"role": "user", "content": "And what is their main product?"},
   {"role": "assistant", "content": "Anthropic's main product is Claude, a family of large language model assistants."},
]
g_chat = kg.generate(input_data=messages)
print("Relations from conversation:")
for s, p, o in g_chat.relations:
   print(f"   ({s}) -[{p}]-> ({o})")
print("n" + "="*70 + "n SECTION 4 — Aggregating multiple sourcesn" + "="*70)
src1 = "Linda is Joe's mother. Ben is Joe's brother."
src2 = "Andrew is Joseph's father. Judy is Andrew's sister. Joseph also goes by Joe."
g_a = kg.generate(input_data=src1)
g_b = kg.generate(input_data=src2)
combined = kg.aggregate([g_a, g_b])
clustered_combined = kg.cluster(combined, context="Family relationships")
print("Entities after clustering:", clustered_combined.entities)
print("Relations after clustering:")
for r in clustered_combined.relations:
   print(f"   {r}")
if getattr(clustered_combined, "entity_clusters", None):
   print("Entity clusters:", dict(clustered_combined.entity_clusters))
print("n" + "="*70 + "n SECTION 5 — Built-in vizn" + "="*70)
builtin_path = "kg_builtin.html"
try:
   KGGen.visualize(g_big, builtin_path, open_in_browser=False)
   print(f"Wrote {builtin_path}")
   display(IFrame(builtin_path, width="100%", height=520))
except Exception as e:
   print(f"Built-in visualize failed ({e}); we'll use the custom pyvis viz below.")
We use a conversation-style input to show how kg-gen extracts structured relations from user-assistant messages. We then generate separate graphs from multiple text sources, aggregate them, and apply clustering to resolve related entities such as “Joe” and “Joseph.” We also try the built-in visualization feature and display the generated HTML graph inside Colab.
print("n" + "="*70 + "n SECTION 6 — NetworkX analyticsn" + "="*70)
def kg_to_networkx(graph):
   G = nx.MultiDiGraph()
   for e in graph.entities:
       G.add_node(e)
   for s, p, o in graph.relations:
       G.add_edge(s, o, label=p)
   return G
G = kg_to_networkx(g_big)
print(f"Nodes: {G.number_of_nodes()}   Edges: {G.number_of_edges()}")
H = nx.Graph(G)
deg_cent = nx.degree_centrality(H)
btw_cent = nx.betweenness_centrality(H)
pr_cent  = nx.pagerank(nx.DiGraph(G)) if G.number_of_edges() else {}
def top(d, k=8): return sorted(d.items(), key=lambda x: -x[1])[:k]
print("nTop entities by degree centrality:")
for n, v in top(deg_cent): print(f"   {n:35s} {v:.3f}")
print("nTop entities by betweenness:")
for n, v in top(btw_cent): print(f"   {n:35s} {v:.3f}")
print("nTop entities by PageRank:")
for n, v in top(pr_cent):  print(f"   {n:35s} {v:.3f}")
try:
   from networkx.algorithms.community import louvain_communities
   communities = louvain_communities(H, seed=42)
except Exception:
   import community as community_louvain
   parts = community_louvain.best_partition(H, random_state=42)
   bins = {}
   for n, c in parts.items(): bins.setdefault(c, set()).add(n)
   communities = list(bins.values())
print(f"nDetected {len(communities)} communities:")
for i, c in enumerate(communities):
   print(f"   Community {i}: {sorted(c)}")
pred_counts = Counter(p for _, _, p in g_big.relations)
print("nMost common predicates:")
for p, n in pred_counts.most_common(10):
   print(f"   {n:3d}  {p}")
print("n" + "="*70 + "n SECTION 7 — Custom pyvis vizn" + "="*70)
palette = ["#e6194B","#3cb44b","#ffe119","#4363d8","#f58231",
          "#911eb4","#42d4f4","#f032e6","#bfef45","#fabed4"]
node_color = {}
for i, c in enumerate(communities):
   for n in c: node_color[n] = palette[i % len(palette)]
net = Network(height="600px", width="100%", directed=True,
             bgcolor="#ffffff", font_color="#222222",
             notebook=True, cdn_resources="in_line")
net.barnes_hut(gravity=-12000, spring_length=180)
for n in G.nodes:
   size = 12 + 80 * pr_cent.get(n, 0.01)
   net.add_node(n, label=n, color=node_color.get(n, "#888888"),
                size=size, title=f"PageRank: {pr_cent.get(n,0):.3f}")
for s, o, data in G.edges(data=True):
   net.add_edge(s, o, label=data.get("label", ""), arrows="to")
pyvis_path = "kg_pyvis.html"
net.write_html(pyvis_path, notebook=False, open_browser=False)
print(f"Wrote {pyvis_path}")
display(IFrame(pyvis_path, width="100%", height=620))
We convert the generated knowledge graph into a NetworkX graph to enable deeper graph analytics. We calculate degree centrality, betweenness centrality, PageRank, predicate frequency, and community structure to identify important entities and relation patterns. We then create a custom PyVis visualization where nodes are sized by PageRank and colored by detected communities.
print("n" + "="*70 + "n SECTION 8 — KG-grounded lookupn" + "="*70)
def lookup(graph, query):
   q = query.lower()
   hits = [(s,p,o) for s,p,o in graph.relations
           if q in s.lower() or q in p.lower() or q in o.lower()]
   return hits
for q in ["transformer", "Anthropic", "Stanford"]:
   print(f"nQ: tell me about '{q}'")
   for s,p,o in lookup(g_big, q):
       print(f"   ({s}) -[{p}]-> ({o})")
def neighbors(G, node, hops=1):
   if node not in G: return set()
   return set(nx.single_source_shortest_path_length(G.to_undirected(), node, cutoff=hops))
print("n2-hop neighborhood of 'machine learning':")
nb = neighbors(G, "machine learning", hops=2) if "machine learning" in G else set()
print("   ", sorted(nb))
print("n" + "="*70 + "n SECTION 9 — Exportn" + "="*70)
def graph_to_dict(graph):
   return {
       "entities": sorted(graph.entities),
       "edges":    sorted(graph.edges),
       "relations":[list(r) for r in graph.relations],
       "entity_clusters": {k: sorted(v) for k,v in (getattr(graph,"entity_clusters",None) or {}).items()},
       "edge_clusters":   {k: sorted(v) for k,v in (getattr(graph,"edge_clusters",None)   or {}).items()},
   }
with open("kg.json", "w") as f:
   json.dump(graph_to_dict(g_big), f, indent=2)
G_simple = nx.DiGraph()
for s,o,data in G.edges(data=True):
   if G_simple.has_edge(s,o):
       G_simple[s][o]["label"] += " | " + data["label"]
   else:
       G_simple.add_edge(s,o,label=data["label"])
nx.write_graphml(G_simple, "kg.graphml")
print("Wrote: kg.json, kg.graphml, kg_builtin.html, kg_pyvis.html")
print("n Tutorial complete.")
We build a simple knowledge graph lookup function that retrieves relations connected to a query term, such as “Transformer,” “Anthropic,” or “Stanford.” We also inspect the two-hop neighborhood of an entity to understand nearby concepts in the graph. Also, we export the knowledge graph as JSON and GraphML for reuse in tools such as Gephi and Cytoscape.
In conclusion, we built a full knowledge graph generation pipeline that moves from basic extraction to advanced graph analysis and visualization. We used kg-gen to identify entities and relationships, apply clustering to merge similar concepts, aggregate graphs from multiple inputs, and convert the result into NetworkX for centrality, PageRank, community detection, and predicate analysis. We also created interactive visualizations with PyVis, performed simple KG-grounded lookup, and exported the final graph as JSON and GraphML. Also, we saw how knowledge graphs help us transform raw text into structured intelligence that is easier to explore, analyze, and reuse.
Check out the Full Codes with Notebook. Also, feel free to follow us on Twitter and don’t forget to join our 150k+ ML SubReddit and Subscribe to our Newsletter. Wait! are you on telegram? now you can join us on telegram as well.
Need to partner with us for promoting your GitHub Repo OR Hugging Face Page OR Product Release OR Webinar etc.? Connect with us
The post How to Build Knowledge Graph Generation Pipelines From Text With kg-gen, NetworkX Analytics, and Interactive Visualizations appeared first on MarkTechPost.