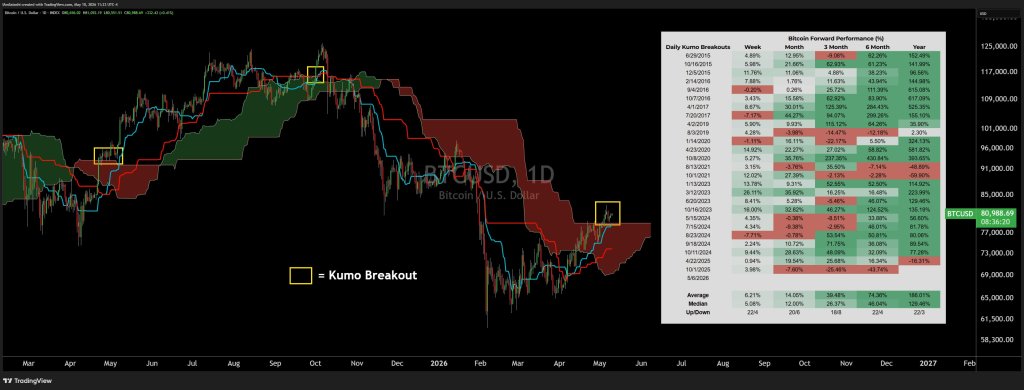
Bitcoin has triggered another daily Kumo breakout, putting a historically bullish technical signal back in focus. Analyst Josh Olszewicz, who posts as CarpeNoctom, shared a chart on X tracking BTC’s forward performance after every daily Kumo breakout since 2015.
“BTC forward performance of daily kumo breakouts since 2015,” CarpeNoctom wrote, alongside a TradingView chart showing the latest breakout dated May 6, 2026.
What This Means For Bitcoin Price
The historical table attached to the chart shows a notably positive skew across completed signals. After prior daily Kumo breakouts, Bitcoin was higher one week later in 22 of 26 cases, with an average gain of 6.21% and a median gain of 5.08%. One month out, BTC was positive in 20 of 26 cases, with an average return of 14.05% and a median of 12.00%.
The signal’s stronger historical profile appears over longer windows. Three months after breakout, Bitcoin was higher in 18 of 26 cases, with an average gain of 39.48% and a median of 26.37%. Six months later, BTC was positive in 22 of 26 cases, with an average return of 74.36% and a median of 46.04%. The one-year data is even more striking: across completed samples, Bitcoin was higher in 22 of 25 cases, with an average gain of 186.01% and a median gain of 129.46%.
The largest one-year forward returns came during major bull-market phases. Breakouts on Sept. 4, 2016 and Oct. 7, 2016 preceded one-year gains of 615.08% and 617.09%, respectively. The April 1, 2017 signal was followed by a 525.35% one-year advance, while the April 23, 2020 breakout led to a 581.82% one-year gain. Another October 2020 breakout produced a 237.35% three-month move, a 430.84% six-month move, and a 393.65% one-year return.
The chart also shows that the signal has not been uniformly reliable. Breakouts during weaker or late-cycle conditions produced negative forward returns in several cases. The Aug. 13, 2021 breakout was followed by a 48.89% one-year decline, while the Oct. 1, 2021 signal preceded a 59.90% one-year drop. More recently, the April 22, 2025 breakout showed positive returns over one week, one month, three months, and six months, but was down 16.31% after one year.
The most recent completed signal before the May 2026 breakout, dated Oct. 1, 2025, also remains a cautionary data point. Bitcoin rose 3.98% after one week, but fell 7.60% after one month, 25.46% after three months, and 43.74% after six months. Its one-year return is not yet available in the table.
For traders, the chart frames the Kumo breakout less as a standalone prediction and more as a historically asymmetric trend signal. The median returns suggest the pattern has often appeared near meaningful upside continuation, but the failed signals cluster around periods where broader market structure deteriorated after the breakout.
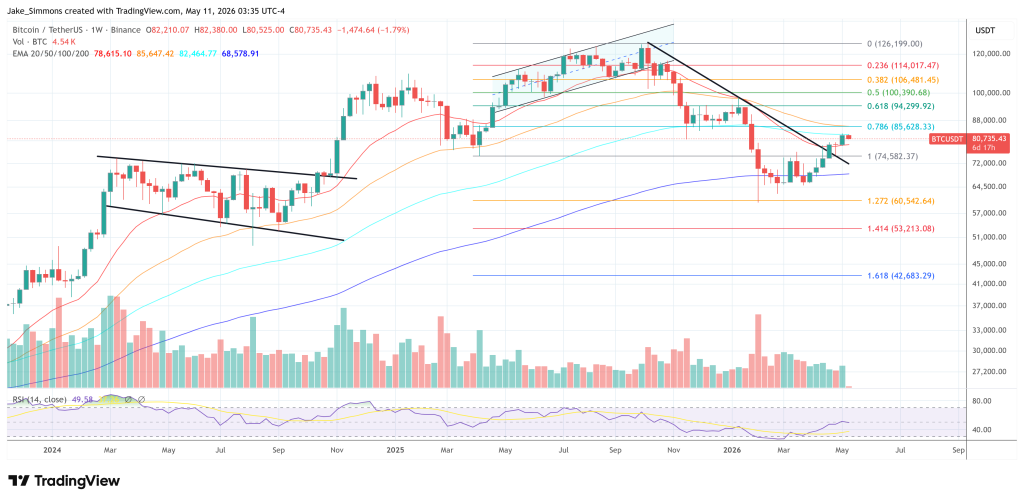
At press time, BTC traded at $80,735.