
Bitcoin has spent April staging a recovery from its March lows, briefly climbing back above $79,000. However, not everyone is convinced of the rebound, and some analysts believe the move is only a mid-bear-market rally before a deeper correction.
One such analyst is one that previously predicted a coming peak in July 2025. Now, the same analyst is predicting how far the Bitcoin price still has to fall before it puts in a true bottom.
Analyst Uses Previous Top Model To Predict Bitcoin Bottom
Crypto analyst Killa made a cycle-top prediction of $121,362 back in June 2025. This call was made months before Bitcoin reached its all-time high of $126,100 in October 2025 and it was off by only about 3.9%. Now, using the same analytical framework that generated that call, Killa has turned the model toward the downside.
The principle behind the projection is that each successive Bitcoin market cycle produces a smaller multiple relative to the prior cycle’s bottom, reflecting the maturation of the asset. His data across five cycles shows the high-to-bottom multiple declining from 15.50x in the first cycle to 7.64x, then 6.26x, and then 4.47x in Cycle 4, where Bitcoin peaked at $69,800 before bottoming at $15,600.
Applying the same rate of reduction, Killa projects the current cycle’s multiple at 3.25x, dividing the $126,100 cycle top to arrive at a base bottom target of $38,800.
To account for the 5% variance that offset his top prediction, he added in two upside scenarios of $40,740 and $42,680. Even at the top of that range, Bitcoin would still be well below the $60,000 level that some market participants have cited as the correction bottom.
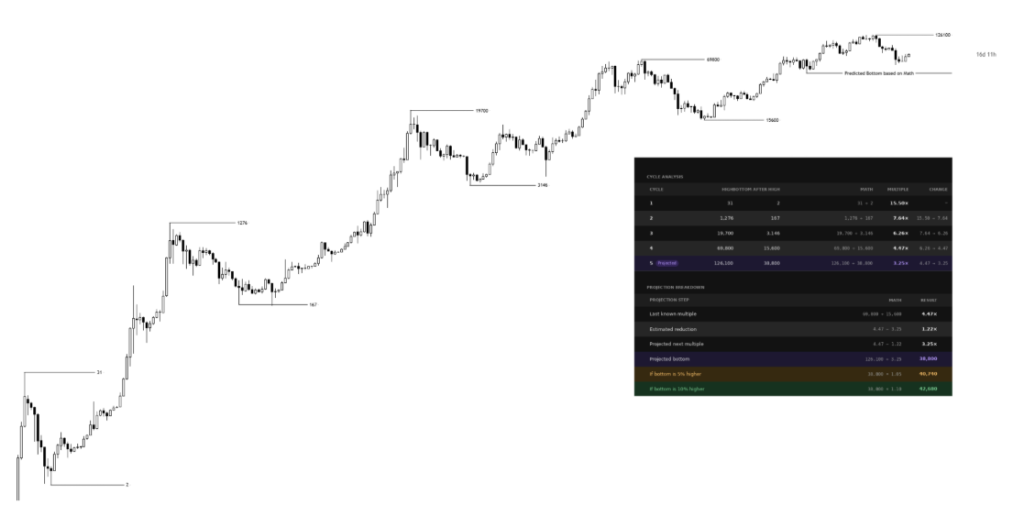
Bitcoin Price Chart. Source: @KillaXBT On X
At the time of writing, Bitcoin is trading at $78,015, meaning a move to $42,680 would still require a drop of about 45%, while a further drop to $38,800 would be close to a 50% correction from current prices.
Three Years Up, One Year Down
Killa’s bottom projection finds support from a separate analysis by analyst CryptoBullet, who approached the question of a bottom from a symmetry standpoint.
CryptoBullet’s weekly Bitcoin chart characterized the current cycle as a five-wave Elliott Wave advance beginning in late 2022, with Wave 5 completing around the $126,000 high in October 2025. The subsequent correction, labeled as a W-X-Y corrective structure in blue, projects a final Wave Y leg down below $50,000 to $45,000.
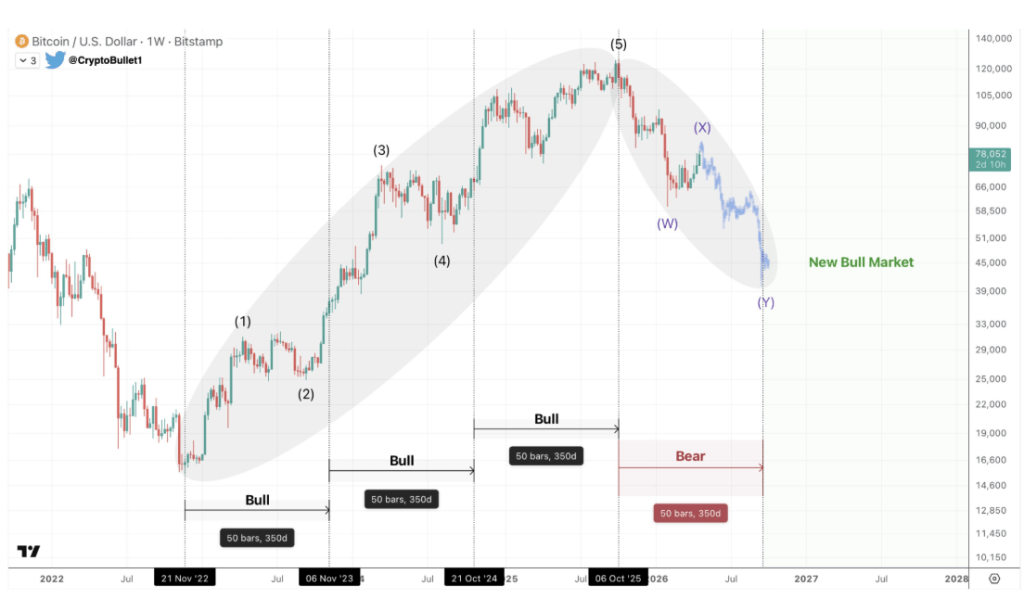
Bitcoin Weekly Chart. Source: @CryptoBullet1 On X
According to the analyst, three years of upward price action from the November 2022 bottom through the 2025 peak cannot reasonably be corrected in less than a year of decline. The current bear phase is shown extending into the second half of 2026 before the bottom structure can be completed.
Featured image from Unsplash, chart from TradingView