
XRP price gained pace for a move above the $2.920 resistance. The price is now correcting some gains and might find bids near $2.920.
- XRP price is facing hurdles and struggling to clear the $3.00 resistance.
- The price is now trading above $2.920 and the 100-hourly Simple Moving Average.
- There was a break below a bullish trend line with support at $2.9650 on the hourly chart of the XRP/USD pair (data source from Kraken).
- The pair could continue to rise if it stays above the $2.920 zone.
XRP Price Remains Supported for Gains
XRP price managed to stay above the $2.8320 level and started a fresh increase, beating Bitcoin and Ethereum. The price climbed above the $2.920 and $2.950 resistance levels.
The bulls even pumped the price above the $3.00 level. A high was formed at $3.0365 and the price is now correcting gains. There was a move below the 23.6% Fib retracement level of the upward move from the $2.794 swing low to the $3.036 high.
Besides, there was a break below a bullish trend line with support at $2.9650 on the hourly chart of the XRP/USD pair. The price is now trading above $2.920 and the 100-hourly Simple Moving Average.
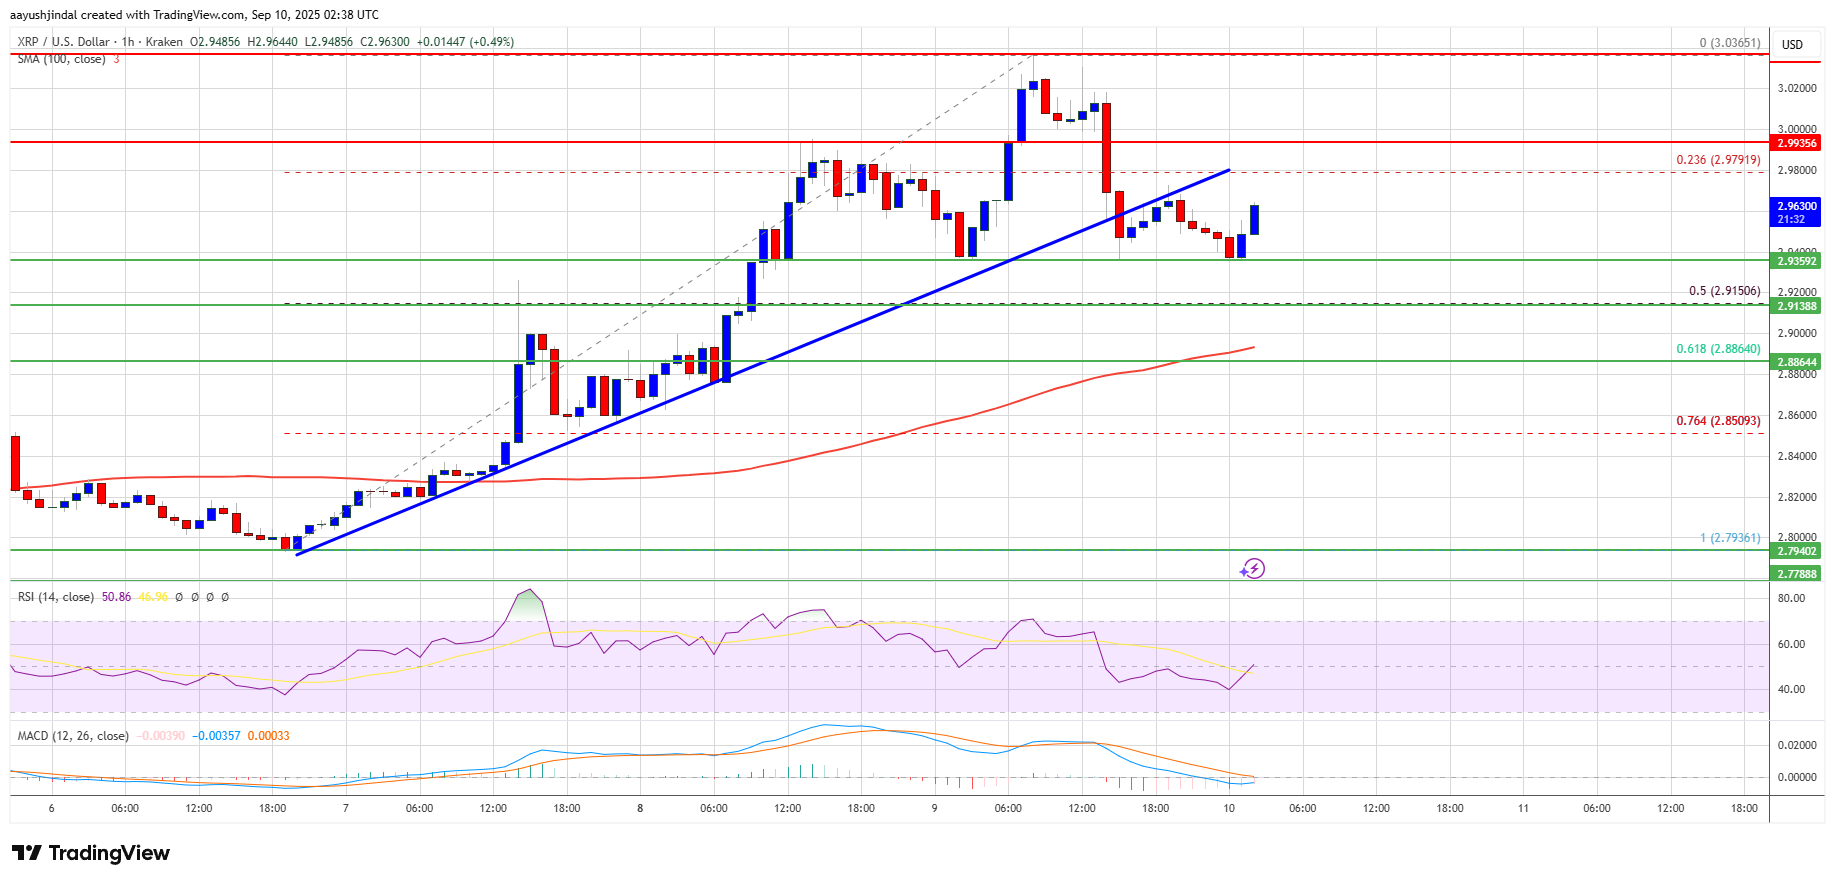
If the bulls protect the $2.920 support, the price could attempt another increase. On the upside, the price might face resistance near the $2.980 level. The first major resistance is near the $3.00 level. A clear move above the $3.00 resistance might send the price toward the $3.0350 resistance. Any more gains might send the price toward the $3.120 resistance. The next major hurdle for the bulls might be near $3.150.
More Downsides?
If XRP fails to clear the $3.00 resistance zone, it could continue to move down. Initial support on the downside is near the $2.9350 level. The next major support is near the $2.920 level or the 50% Fib retracement level of the upward move from the $2.794 swing low to the $3.036 high.
If there is a downside break and a close below the $2.920 level, the price might continue to decline toward $2.860. The next major support sits near the $2.850 zone, below which the price could gain bearish momentum.
Technical Indicators
Hourly MACD – The MACD for XRP/USD is now losing pace in the bullish zone.
Hourly RSI (Relative Strength Index) – The RSI for XRP/USD is now near the 50 level.
Major Support Levels – $2.9350 and $2.920.
Major Resistance Levels – $2.980 and $3.00.