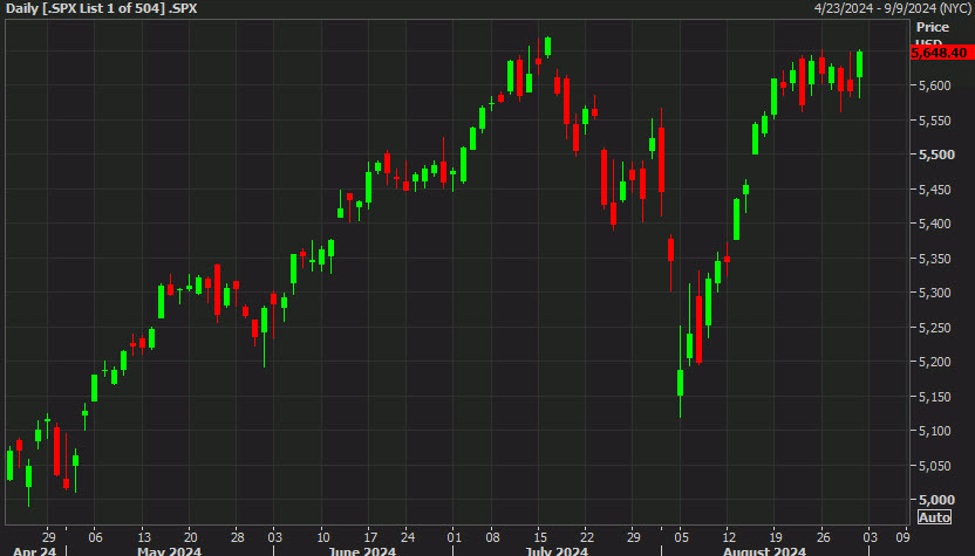
SPX Daily Chart
The last day of stock trading in August was not without its share of action. The S&P 500 opened strongly and then pared its gains to trade in negative territory by midday. However, some steady bids emerged in the afternoon before a massive late-day buying spree.
Much of this will likely technically be on the long weekend at the end of the month, but it caps off a busy weekend.
S&P 500 1.0%
Nasdaq Composite +1.1%
Dow Jones Industrial Average +0.6%
Russell 2000 +0.3%
Toronto TSX +0.2%
In the week:
S&P 500 +0.25%
Nasdaq Composite -0.9%
Russell 2000 -0.4%
Toronto TSX -0.1%
In the month:
S&P 500 +2.3%
Nasdaq Composite +0.6%
Dow Jones Industrial Average +1.8%
Russell 2000 -2.0%
Toronto TSX +0.6%
These monthly numbers may not seem impressive at first glance, but they come after a huge sell-off at the start.
The monthly chart of the Nasdaq Composite is now showing a double doji candle. This is a precursor to a big move ahead. Given the impressive recovery from the August lows, I would be bullish but it’s hard to be confident after the Nvidia drop and with the negative seasonal backdrop for September.
Nasdaq monthly
The post US stock markets catch a sizzling late-day bid but Nasdaq ends three-week winning streak first appeared on Investorempires.com.