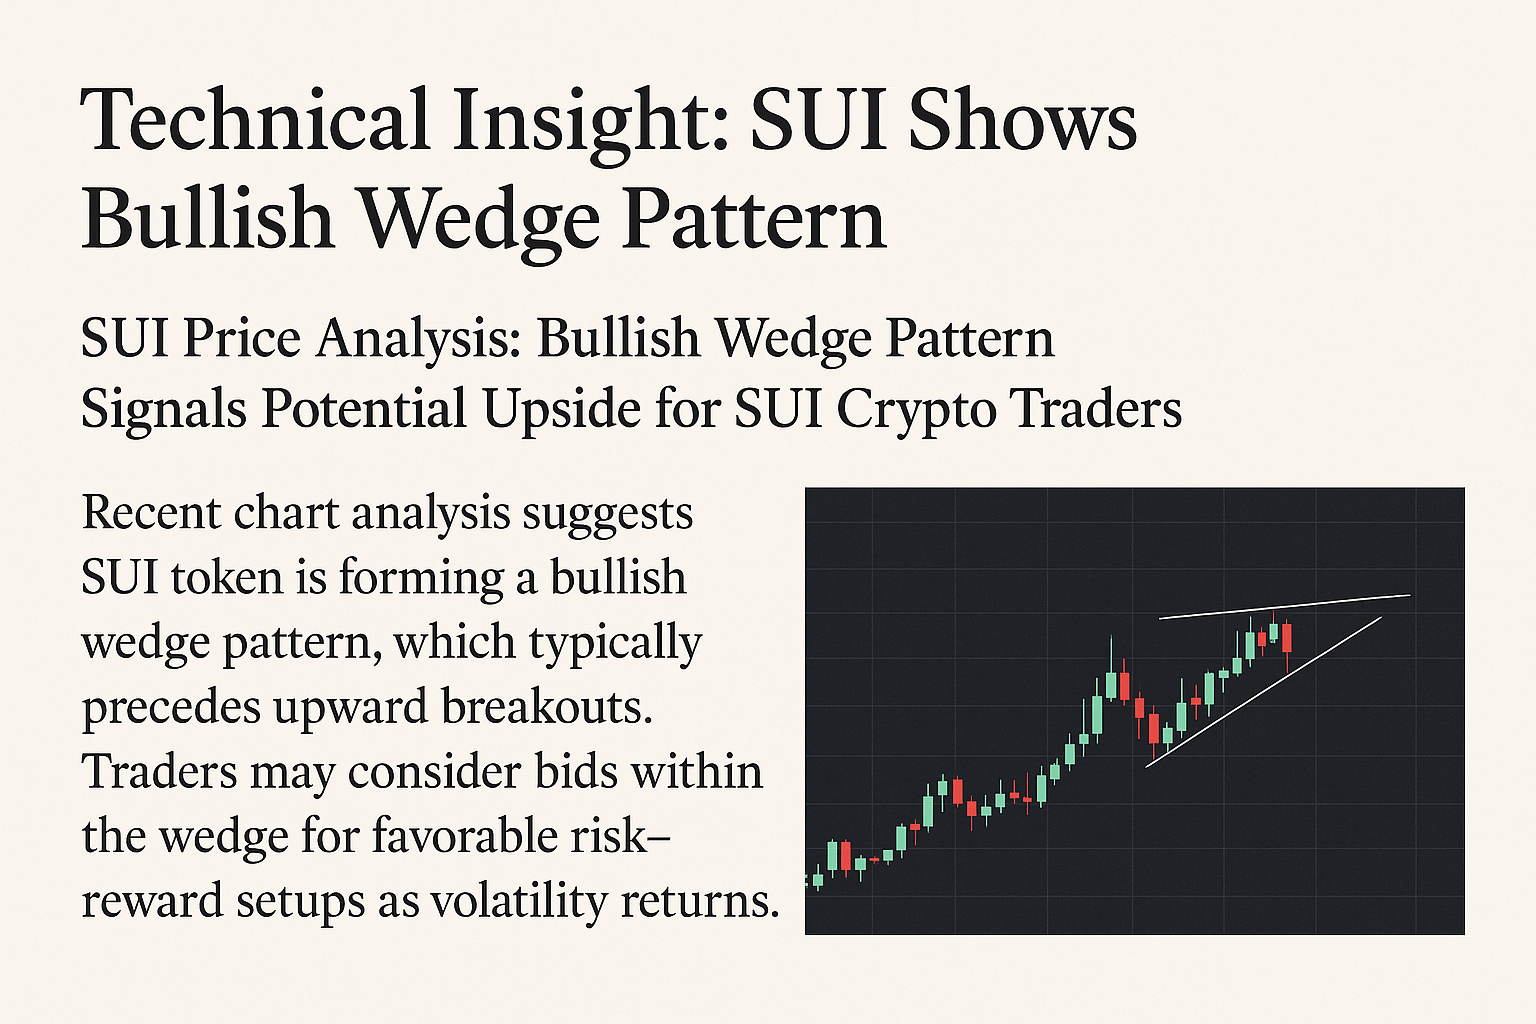
SUI Price Analysis: Bullish Wedge Pattern Signals Potential Upside for SUI Crypto Traders
The SUI token has recently caught the attention of technical analysts as its price structure begins to form a bullish wedge pattern—a setup often seen before a strong upward breakout. This classic chart formation is characterized by converging trendlines, where the lower trendline rises faster than the upper one, gradually compressing price action into a tight range.
Understanding the Bullish Wedge
A bullish wedge is typically a continuation pattern, appearing after a preceding uptrend. It reflects a market that is temporarily consolidating while maintaining underlying buying pressure. As the wedge narrows, volatility decreases, but the potential for an explosive breakout increases.
In the case of SUI, the pattern has emerged after a steady climb from recent lows, suggesting that bulls are in control despite short-term pullbacks. The current technical landscape indicates that momentum traders may be watching closely for a decisive move above the upper resistance line of the wedge.
Market Sentiment and Key Levels
-
Support Zone: Traders are eyeing bids near the lower wedge boundary, which has consistently acted as a dynamic support area.
-
Resistance Breakout: A close above the wedge’s upper boundary on high volume could be the trigger for a sharp upward rally.
-
Risk–Reward Consideration: Positioning within the wedge offers defined risk (below support) with potential for substantial upside, a combination attractive to swing traders.
Potential Catalysts
While technical patterns often provide reliable clues, fundamental drivers can accelerate or delay expected moves. For SUI, developments in the broader crypto market, upcoming blockchain updates, or shifts in investor sentiment toward altcoins could act as catalysts for the anticipated breakout.
With the bullish wedge pattern in play, SUI traders may be looking at a favorable risk–reward opportunity. As with all technical setups, confirmation is key—waiting for a breakout with solid volume can reduce the risk of false signals. In an environment where volatility is making a comeback, patterns like this can be valuable tools for identifying potential high-probability trades.