
In Part 1 of our series, we introduced a proactive cost management solution for Amazon Bedrock, featuring a robust cost sentry mechanism designed to enforce real-time token usage limits. We explored the core architecture, token tracking strategies, and initial budget enforcement techniques that help organizations control their generative AI expenses.
Building upon that foundation, this post explores advanced cost monitoring strategies for generative AI deployments. We introduce granular custom tagging approaches for precise cost allocation, and develop comprehensive reporting mechanisms.
Solution overview
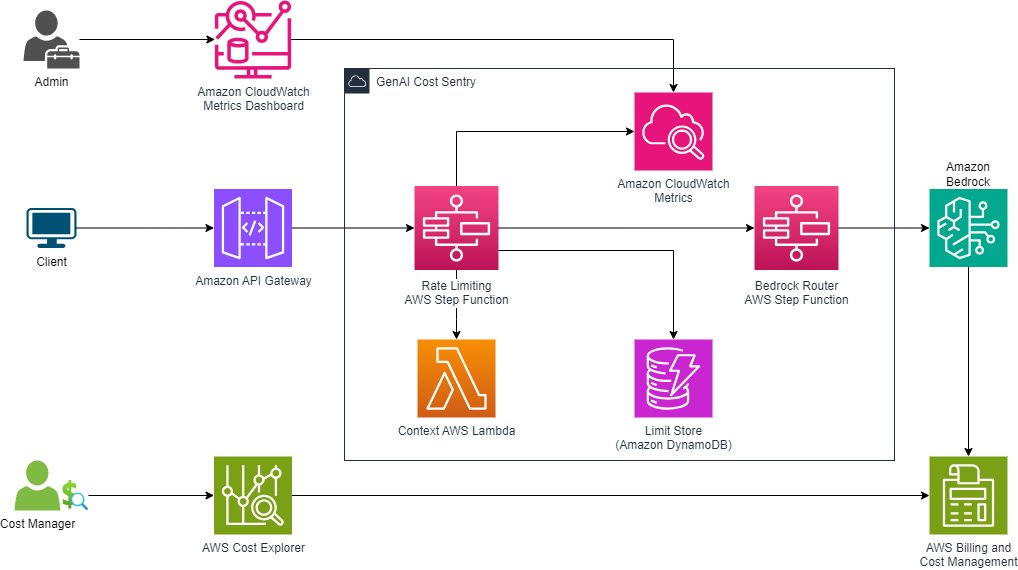
The cost sentry solution introduced in Part 1 was developed as a centralized mechanism to proactively limit generative AI usage to adhere to prescribed budgets. The following diagram illustrates the core components of the solution, adding in cost monitoring through AWS Billing and Cost Management.
Invocation-level tagging for enhanced traceability
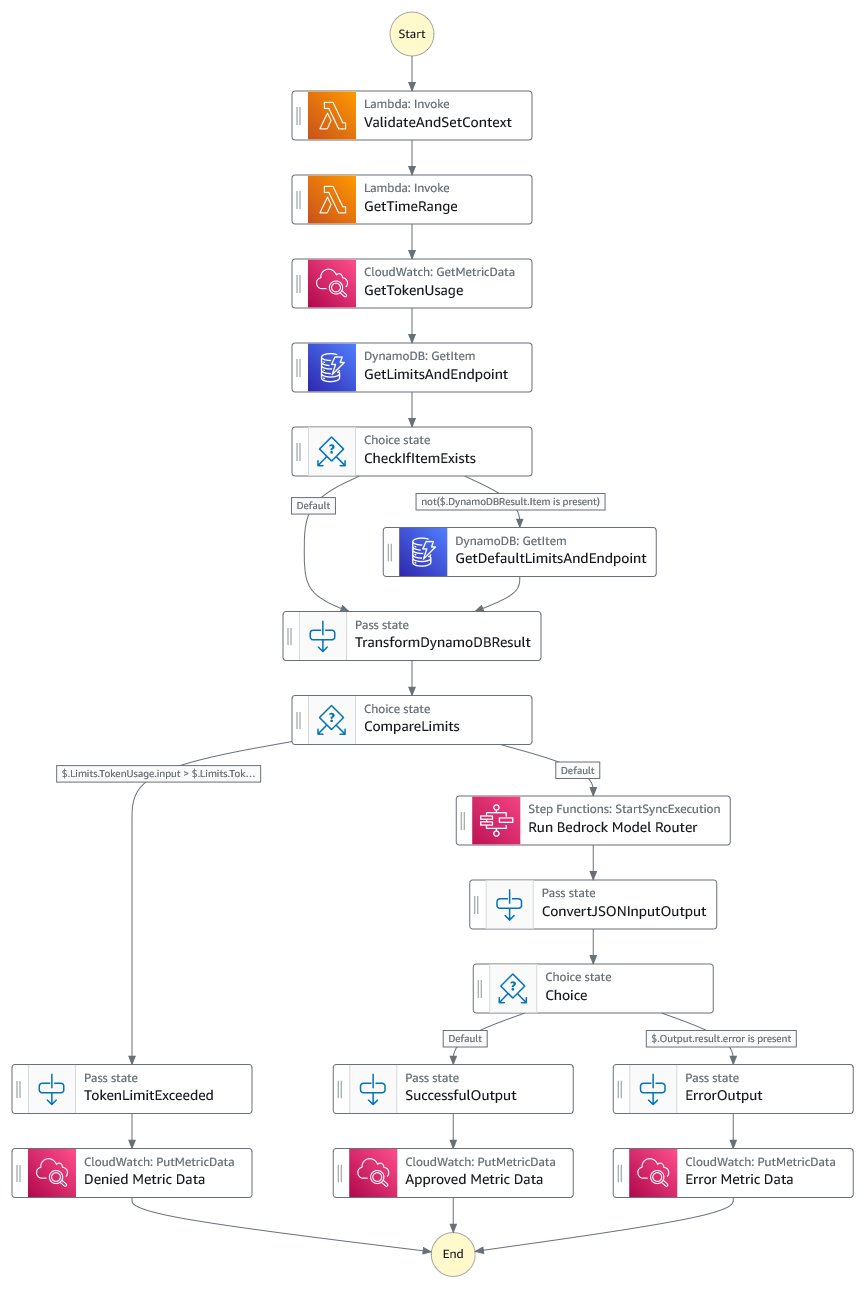
Invocation-level tagging extends our solution’s capabilities by attaching rich metadata to every API request, creating a comprehensive audit trail within Amazon CloudWatch logs. This becomes particularly valuable when investigating budget-related decisions, analyzing rate-limiting impacts, or understanding usage patterns across different applications and teams. To support this, the main AWS Step Functions workflow was updated, as illustrated in the following figure.
Enhanced API input
We also evolved the API input to support custom tagging. The new input structure introduces optional parameters for model-specific configurations and custom tagging:
The input structure comprises three key components:
- model – Maps simple names (for example,
claude-3) to full Amazon Bedrock model IDs (for example,anthropic.claude-3-sonnet-20240229-v1:0) - input – Provides a messages array for prompts, supporting both single-turn and multi-turn conversations
- tags – Supports application-level tracking, with
applicationIdas the required field andcostCenterandenvironmentas optional fields
In this example, we use different cost centers for sales, services, and support to simulate the use of a business attribute to track usage and spend for inference in Amazon Bedrock. For example:
Validation and tagging
A new validation step was added to the workflow for tagging. This step uses an AWS Lambda function to add validation checks and maps the model requested to the specific model ID in Amazon Bedrock. It supplements the tags object with tags that will be required for downstream analysis.
The following code is an example of a simple map to get the appropriate model ID from the model specified:
Logging and analysis
By using CloudWatch metrics with custom-generated tags and dimensions, you can track detailed metrics across multiple dimensions such as model type, cost center, application, and environment. Custom tags and dimensions show how teams use AI services. To see this analysis, steps were implemented to generate custom tags, store metric data, and analyze metric data:
- We include a unique set of tags that capture contextual information. This can include user-supplied tags as well as ones that are dynamically generated, such as
requestIdandtimestamp: - As each workflow is executed, the limit for each model will be evaluated to make sure the request is within budgetary guidelines. The workflow will end based on three possible outcomes:
- Rate limit approved and invocation successful
- Rate limit approved and invocation unsuccessful
- Rate limit denied
The custom metric data is saved in CloudWatch in the
GenAIRateLimitingnamespace. This namespace includes the following key metrics:- TotalRequests – Counts every invocation attempt regardless of outcome
- RateLimitApproved – Tracks requests that passed rate limiting checks
- RateLimitDenied – Tracks requests blocked by rate limiting
- InvocationFailed – Counts requests that failed during model invocation
- InputTokens – Measures input token consumption for successful requests
- OutputTokens – Measures output token consumption for successful requests
Each metric includes dimensions for
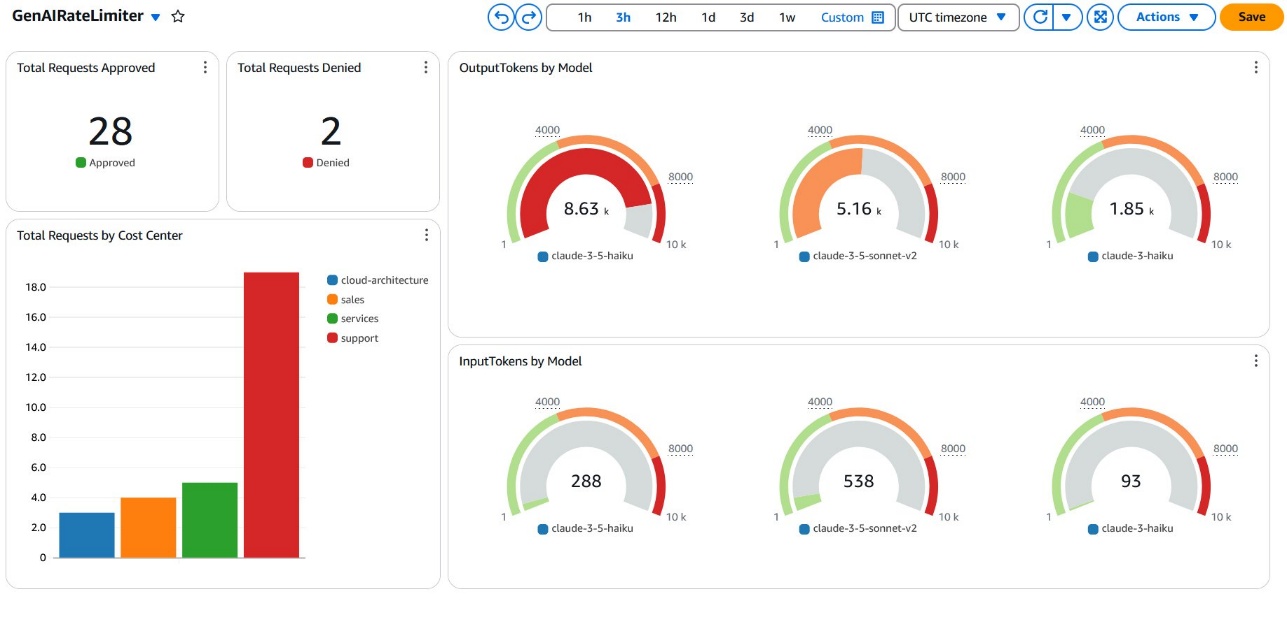
Model,ModelId,CostCenter,Application, andEnvironmentfor data analysis. - We use CloudWatch metrics query capabilities with math expressions to analyze the data collected by the workflow. The data can be displayed in a variety of visual formats to get a granular view of requests by the dimensions provided, such as model or cost center. The following screenshot shows an example dashboard that displays invocation metrics where one model has reached its limit.
Additional Amazon Bedrock analytics
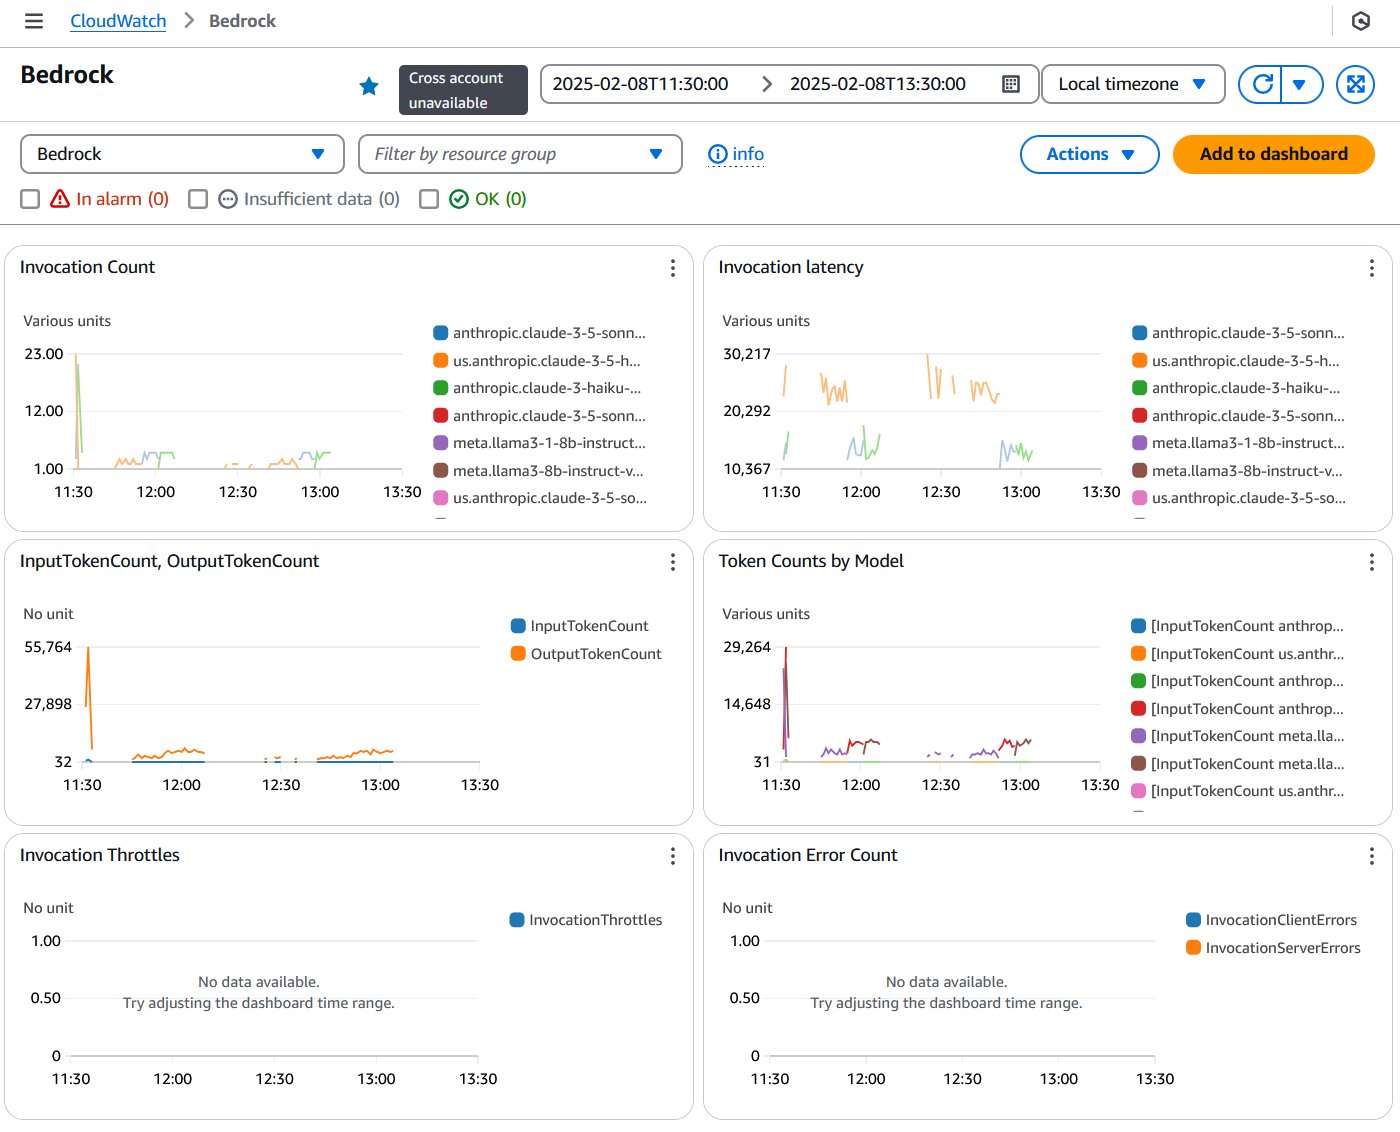
In addition to the custom metrics dashboard, CloudWatch provides automatic dashboards for monitoring Amazon Bedrock performance and usage. The Bedrock dashboard offers visibility into key performance metrics and operational insights, as shown in the following screenshot.
Cost tagging and reporting
Amazon Bedrock has introduced application inference profiles, a new capability that organizations can use to apply custom cost allocation tags to track and manage their on-demand foundation model (FM) usage. This feature addresses a previous limitation where tagging wasn’t possible for on-demand FMs, making it difficult to track costs across different business units and applications. You can now create custom inference profiles for base FMs and apply cost allocation tags like department, team, and application identifiers. These tags integrate with AWS cost management tools including AWS Cost Explorer, AWS Budgets, and AWS Cost Anomaly Detection, enabling detailed cost analysis and budget control.
Application inference profiles
To start, you must create application inference profiles for each type of usage you want to track. In this case, the solution defines custom tags for costCenter, environment, and applicationId. An inference profile will also be based on an existing Amazon Bedrock model profile, so you must combine the desired tags and model into the profile. At the time of writing, you must use the AWS Command Line Interface (AWS CLI) or AWS API to create one. See the following example code:
This command creates a profile for the sales cost center and production environment using Anthropic’s Claude Haiku 3.5 model. The output from this command is an Amazon Resource Name (ARN) that you will use as the model ID. In this solution, the ValidateAndSetContext Lambda function was modified to allow for specifying the model by cost center (for example, sales). To see which profiles you created, use the following command:
aws bedrock list-inference-profiles --type-equals APPLICATION
After the profiles have been created and the validation has been updated to map cost centers to the profile ARNs, the workflow will start running inference requests with the aligned profile. For example, when the user submits a request, they will specify the model as sales, services, or support to align with the three cost centers defined. The following code is a similar map to the previous example:
To query CloudWatch metrics for the model usage correctly when using application inference profiles, you must specify the unique ID for the profile (the last part of the ARN). CloudWatch will store metrics like token usage based on the unique ID. To support both profile and direct model usage, the Lambda function was modified to add a new tag for modelMetric to be the appropriate term to use to query for token usage. See the following code:
Cost Explorer
Cost Explorer is a powerful cost management tool that provides comprehensive visualization and analysis of your cloud spending across AWS services, including Amazon Bedrock. It offers intuitive dashboards to track historical costs, forecast future expenses, and gain insights into your cloud consumption. With Cost Explorer, you can break down expenses by service, tags, and custom dimensions, for detailed financial analysis. The tool updates on a daily basis.
When you use application inference profiles with Amazon Bedrock, your AI service usage is automatically tagged and flows directly into Billing and Cost Management. These tags enable detailed cost tracking across different dimensions like cost center, application, and environment. This means you can generate reports that break down Amazon Bedrock AI expenses by specific business units, projects, or organizational hierarchies, providing clear visibility into your generative AI spending.
Cost allocation tags
Cost allocation tags are key-value pairs that help you categorize and track AWS resource costs across your organization. In the context of Amazon Bedrock, these tags can include attributes like application name, cost center, environment, or project ID. To activate a cost allocation tag, you must first enable it on the Billing and Cost Management console. After they’re activated, these tags will appear in your AWS Cost and Usage Report (CUR), helping you break down Amazon Bedrock expenses with granular detail.
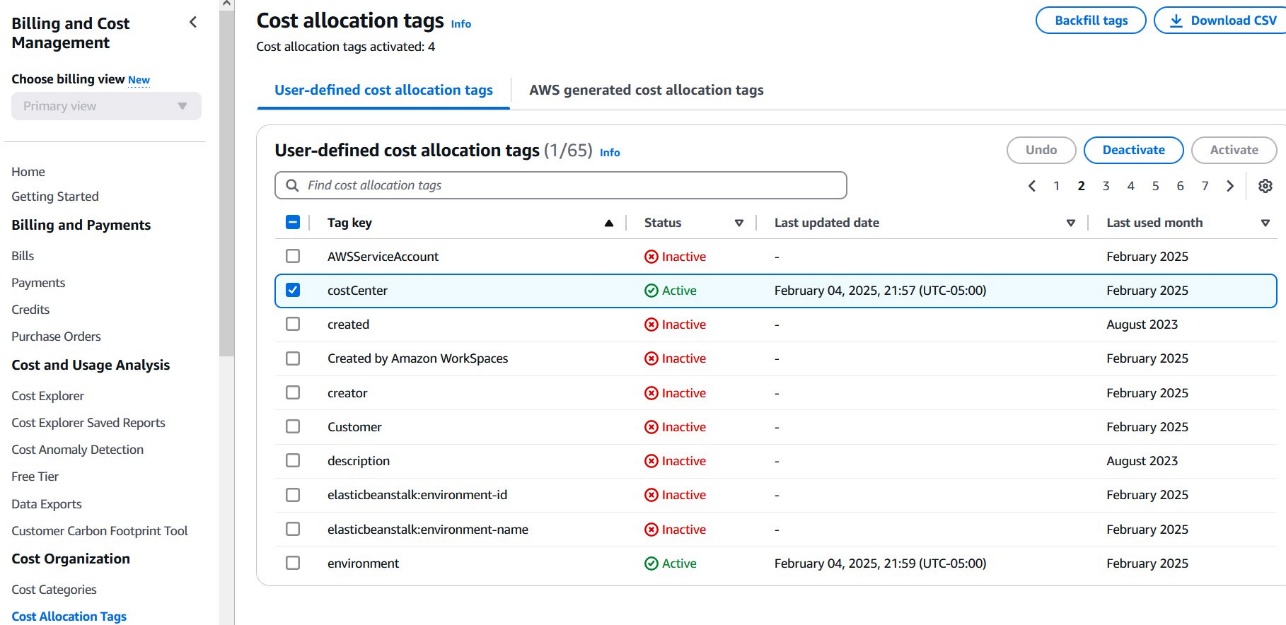
To activate a cost allocation tag, complete the following steps:
- On the Billing and Cost Management console, in the navigation pane, choose Cost Allocation Tags.
- Locate your tag (for this example, it’s named
costCenter) and choose Activate. - Confirm the activation.
After activation, the costCenter tag will appear in your CUR and will be used in Cost Explorer. It might take 24 hours for the tag to become fully active in your billing reports.
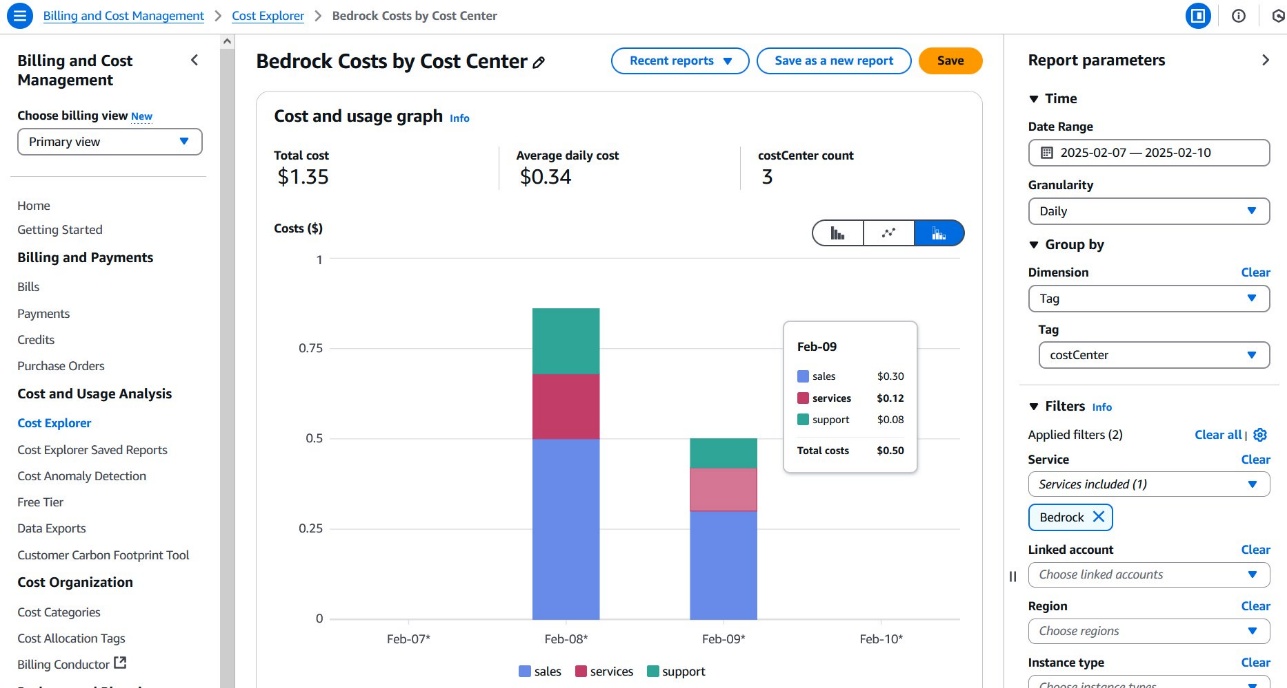
Cost Explorer reporting
To create an Amazon Bedrock usage report in Cost Explorer based on your tag, complete the following steps:
- On the Billing and Cost Management console, choose Cost Explorer in the navigation pane.
- Set your desired date range (relative time range or custom period).
- Select Daily or Monthly granularity.
- On the Group by dropdown menu, choose Tag.
- Choose
costCenteras the tag key. - Review the displayed Amazon Bedrock costs broken down by each unique cost center value.
- Optionally, filter the values by applying a filter in the Filters section:
- Choose Tag filter.
- Choose the costCenter tag.
- Choose specific cost center values you want to analyze.
The resulting report will provide a detailed view of Amazon Bedrock AI service expenses, helping you compare spending across different organizational units or projects with precision.
Summary
The AWS Cost and Usage Reports (including budgets) act as trailing edge indicators because they show what you’ve already spent on Amazon Bedrock after the fact. By blending real-time alerts from Step Functions with comprehensive cost reports, you can get a 360-degree view of your Amazon Bedrock usage. This reporting can alert you before you overspend and help you understand your actual consumption. This approach gives you the power to manage AI resources proactively, keeping your innovation budget on track and your projects running smoothly.
Try out this cost management approach for your own use case, and share your feedback in the comments.
About the Author
 Jason Salcido is a Startups Senior Solutions Architect with nearly 30 years of experience pioneering innovative solutions for organizations from startups to enterprises. His expertise spans cloud architecture, serverless computing, machine learning, generative AI, and distributed systems. Jason combines deep technical knowledge with a forward-thinking approach to design scalable solutions that drive value, while translating complex concepts into actionable strategies.