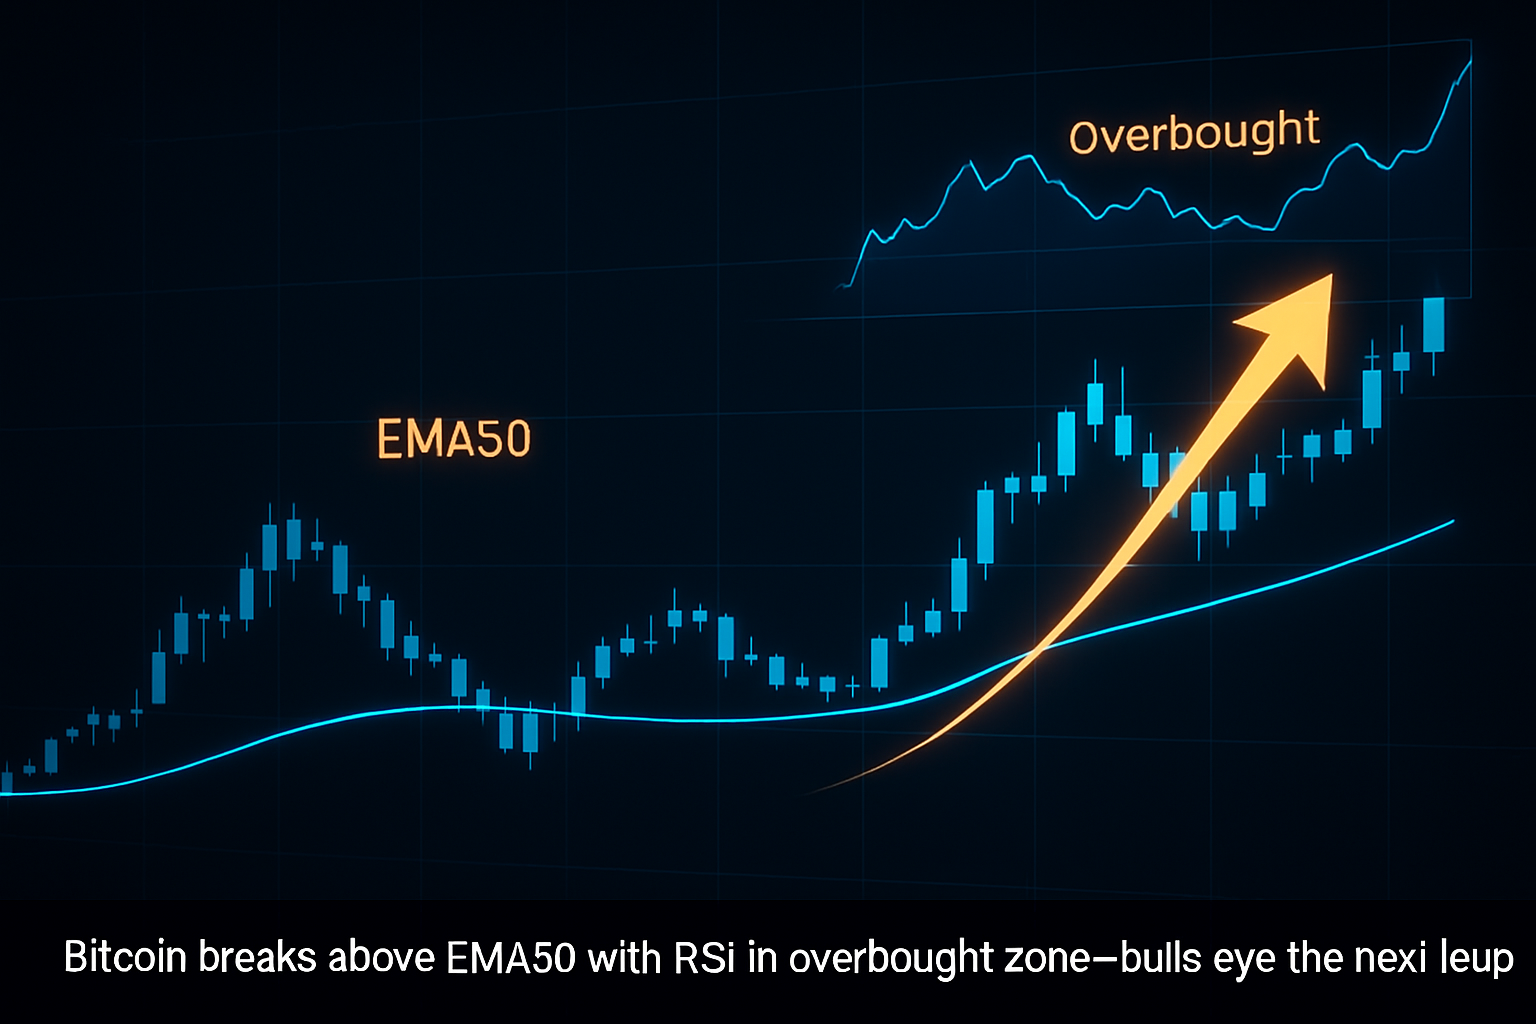
Bitcoin has once again caught the attention of traders and analysts as it breaks through a significant technical barrier—its 50-day Exponential Moving Average (EMA50)—and climbs into the overbought Relative Strength Index (RSI) zone. This classic combination is now fueling optimism for further gains in the near term, despite warnings of a potential short-term correction.
EMA50 Break: A Bullish Signal
Breaking above the EMA50 often signals a shift in market sentiment. For weeks, Bitcoin was consolidating in a tight range below this moving average, which had acted as a dynamic resistance. Now that this level has been breached, the technical landscape suggests bullish momentum is building.
From a trend perspective, the EMA50 is often used as a mid-range trend indicator. Once price moves above it and sustains, many institutional and retail traders interpret it as a sign that the asset could be transitioning from a consolidation or downtrend into a new uptrend phase. This shift in psychology can trigger new buy orders, especially from algorithmic trading bots programmed to react to such crossovers.
RSI in Overbought Zone: What Does It Mean?
However, technical indicators rarely work in isolation. The Relative Strength Index (RSI), which measures the magnitude of recent price changes to evaluate overbought or oversold conditions, has now entered overbought territory (typically considered above 70).
While this might sound like a warning signal, it isn’t necessarily bearish. An overbought RSI can also mean strong upward momentum. Historically, Bitcoin has demonstrated the ability to remain in overbought zones for extended periods during bull runs, grinding higher while skeptics wait on the sidelines for a dip that never comes.
That said, overbought readings can also precede short-term pullbacks or consolidations—healthy pauses that allow the market to catch its breath before resuming the uptrend.
What’s Next?
According to technical analysts from Economies.com and other crypto research desks, the most likely scenario is a minor pullback or sideways movement in the coming sessions, possibly retesting the EMA50 from above. This could offer a lower-risk entry point for traders who missed the initial breakout.
Beyond that, if Bitcoin maintains its structure and doesn’t fall back below the EMA50, the next leg upward could target resistance levels around $75,000 and possibly new all-time highs, especially if supported by macro factors like declining inflation or ETF inflows.
On-Chain Metrics Align
Adding fuel to the bullish case, on-chain metrics—like the decline in exchange-held BTC and rising long-term holder activity—suggest that many investors are still in accumulation mode. Supply is tightening while demand remains steady or increases—classic ingredients for a supply shock.
While nothing is guaranteed in crypto markets, Bitcoin’s recent move above the EMA50 combined with bullish RSI momentum is a technically strong setup. Investors should remain cautious of short-term volatility but optimistic about the medium-term trend, especially if macro conditions remain favorable.
As always, risk management remains key. But the charts seem to suggest the bulls are back in control—for now.