Bitcoin (BTC), the world’s leading cryptocurrency, has shown signs of short-term weakness as it breaks below its established bullish trend line. The move has caught the attention of traders and analysts alike, signaling a potential shift in market sentiment and raising questions about the next direction for the digital asset.
Breaking the Trend
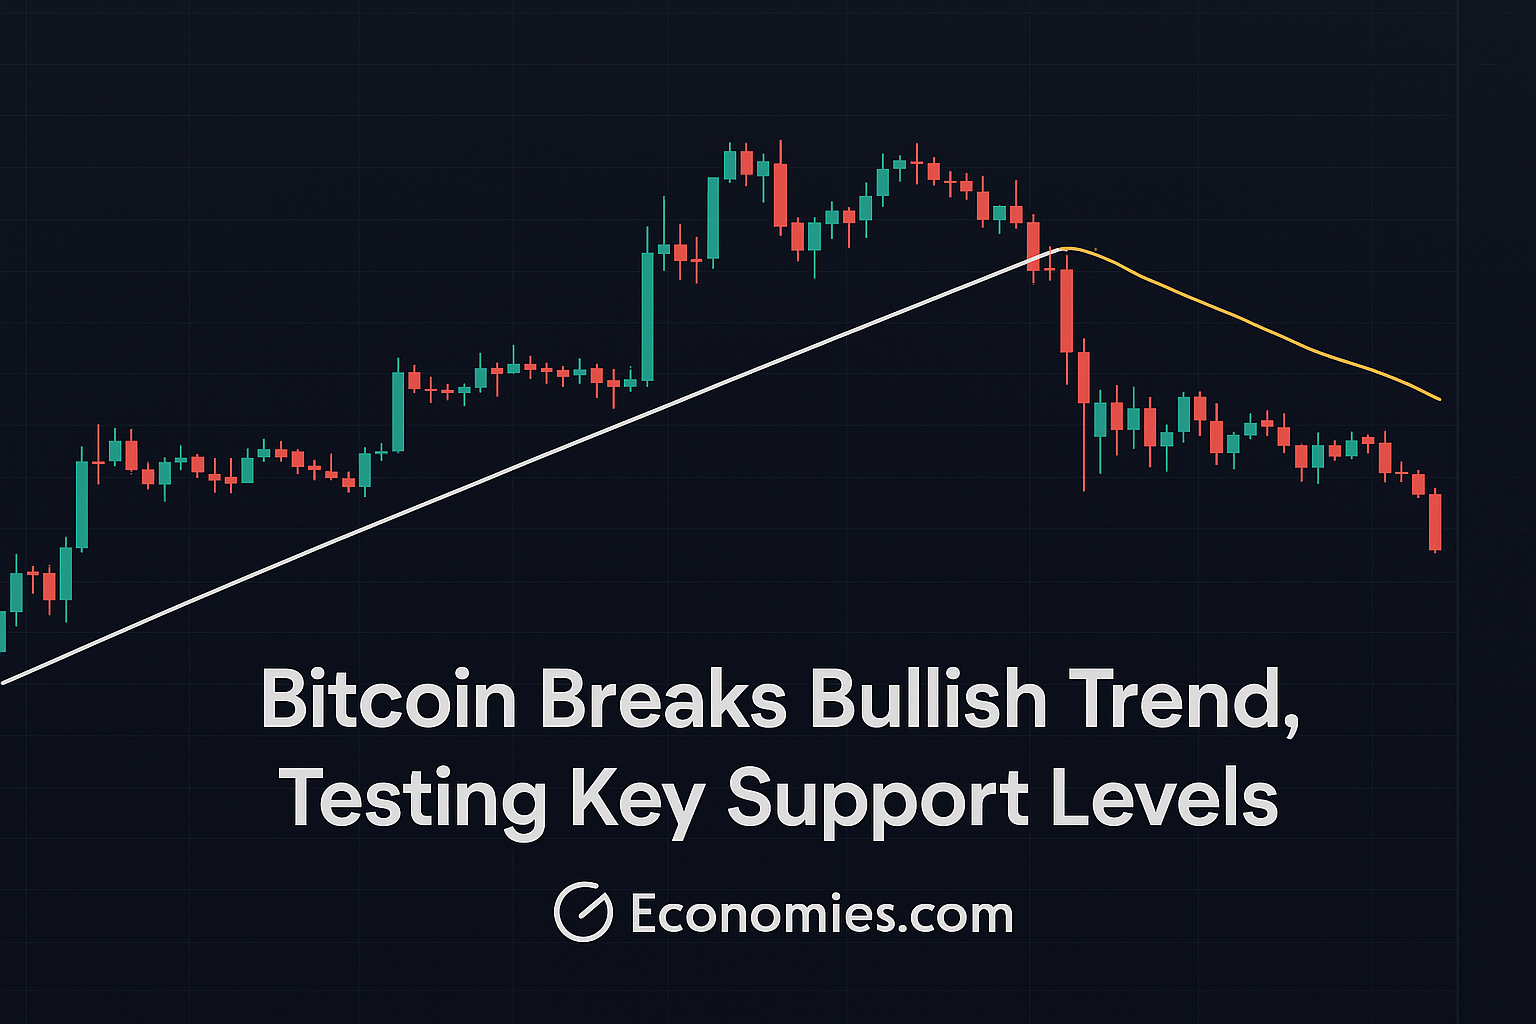
Bitcoin had been enjoying a period of steady upward movement, supported by bullish technical patterns and macroeconomic optimism. However, recent price action shows a break below the ascending trend line—a key structure that had been acting as dynamic support over the past weeks. This breach is often interpreted as a bearish signal, suggesting that buying momentum has weakened.
Adding to the concern is Bitcoin’s fall below the 50-period Exponential Moving Average (EMA50) on the hourly chart. This moving average is widely used to track medium-term price strength, and a break below it typically indicates increased selling pressure.
Testing Support Zones
After the trend line breakdown, BTC began testing crucial support zones. The most immediate support lies near $93,500, with additional zones around $92,500 and $91,200. If these levels fail to hold, the next leg down could see Bitcoin dip toward $90,000 or lower in the short term.
These support levels are not just psychological markers—they are backed by recent volume clusters and past price reactions. Traders should monitor these zones closely as they could dictate the next major move.
The Bigger Picture
Despite the short-term bearish signals, the longer-term outlook remains cautiously optimistic. Institutional interest in Bitcoin is still strong, and macroeconomic uncertainties continue to drive interest in decentralized, non-sovereign assets. However, volatility is inherent in this space, and trend reversals can happen quickly.
Technical traders will be watching for a potential bounce back above the EMA50 and the $95,000 resistance to regain bullish momentum. A decisive close above these levels could invalidate the current bearish sentiment and signal a new rally phase.
What Traders Should Watch
-
Volume spikes near support zones – Indicating accumulation or panic selling.
-
Reclaim of EMA50 – A potential sign of renewed buying pressure.
-
Macro news – Regulatory updates or interest rate news can trigger volatility.
-
On-chain data – Monitoring whale movement and exchange flows could provide early signals.
Bitcoin’s recent dip below its bullish trend line and the EMA50 suggests that the market may be entering a short-term consolidation or correction phase. While long-term fundamentals remain intact, technical traders should prepare for increased volatility and remain vigilant around key support levels. Whether this is a temporary shakeout or the start of a broader decline depends on the coming days’ price action and volume confirmation.